7.11
7.11.1 The Poisson Distribution
The poisson distribution has the following PDF:
\[ f_X(x) = \frac{\lambda^n e^{-\lambda}}{n!} \]
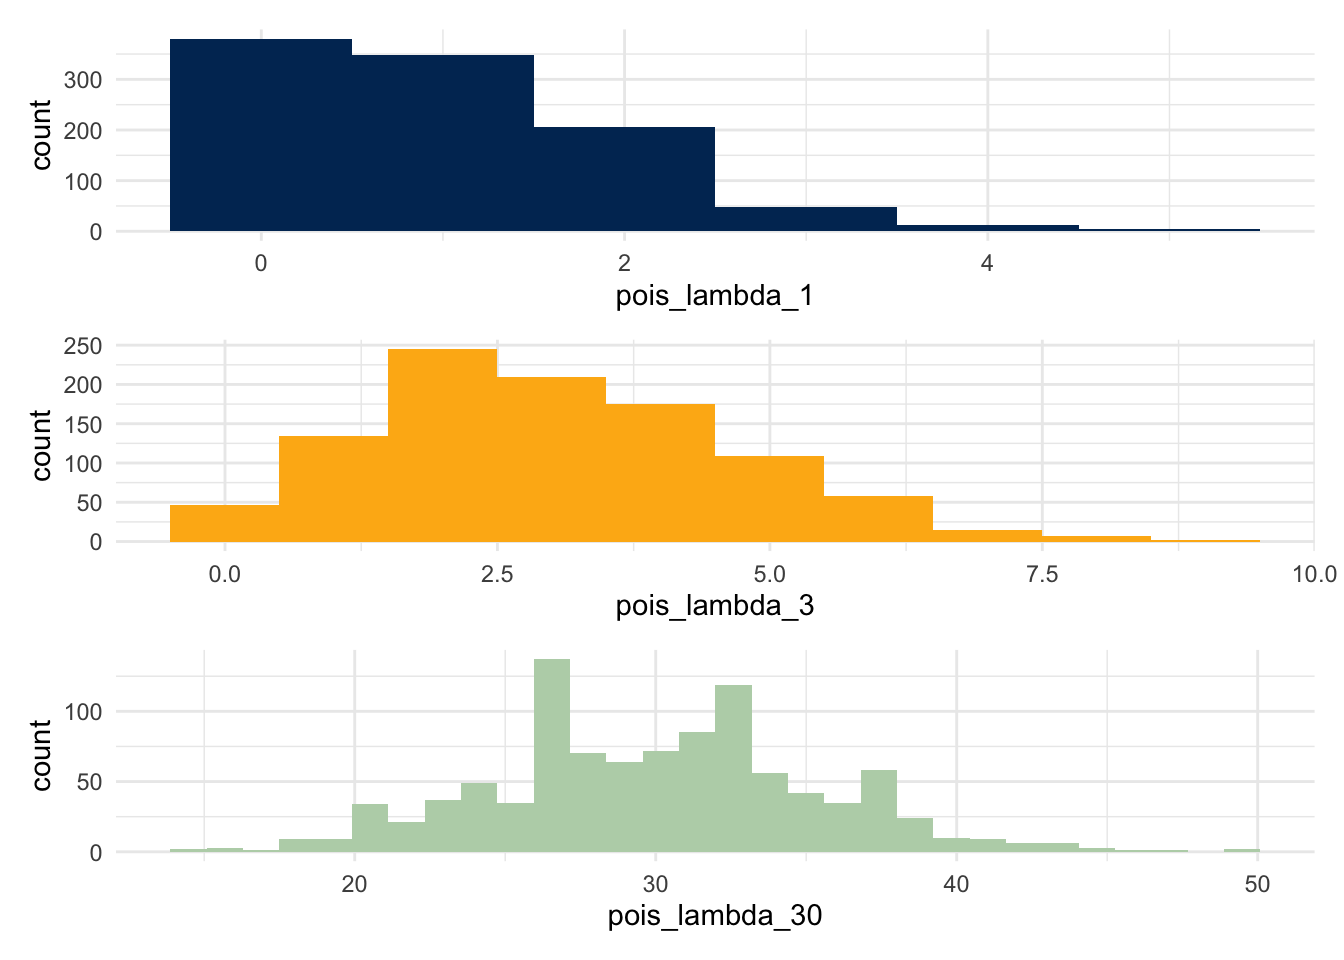
The key shape parameter for a poisson function is \(\lambda\); we show three different distributions, setting this shape parameter to be 1, 3, and 30 respectively. Notice that the limits on these plots are not set to be the same; for example, the range in the third plot is considerably larger than the first.
Code
pois_lambda_1  <- rpois(n=1000, lambda=1)
pois_lambda_3  <- rpois(n=1000, lambda=3)
pois_lambda_30 <- rpois(n=1000, lambda=30)

plot_1  <- ggplot() + aes(x=pois_lambda_1) + geom_histogram(bins=6, fill = berkeley_blue)
plot_3  <- ggplot() + aes(x=pois_lambda_3) + geom_histogram(bins=10, fill = berkeley_gold)
plot_30 <- ggplot() + aes(x=pois_lambda_30) + geom_histogram(bins=30, fill = berkeley_sather)

plot_1 / plot_3 / plot_30
What does this changing distribution do to the p-values?
7.11.2 Write a Simulation
Code
pois_sim <- function(num_observations, lambda_one, lambda_two) {

  t_test_result <- rep(NA, 10000)
  wilcox_result <- rep(NA, 10000)

  for(i in 1:10000) {
    group_one <- rpois(n=num_observations, lambda=lambda_one)
    group_two <- rpois(n=num_observations, lambda=lambda_two)

    t_test_result[i] <- t.test(group_one, group_two)$p.value
    wilcox_result[i] <- wilcox.test(x=group_one, y=group_two)$p.value
  }

  df <- data.table(
    p_value = c(t_test_result, wilcox_result),
    test    = rep(c('t_test', 'wilcox_test'), each = 10000)
  )

  return(df)
}
Code

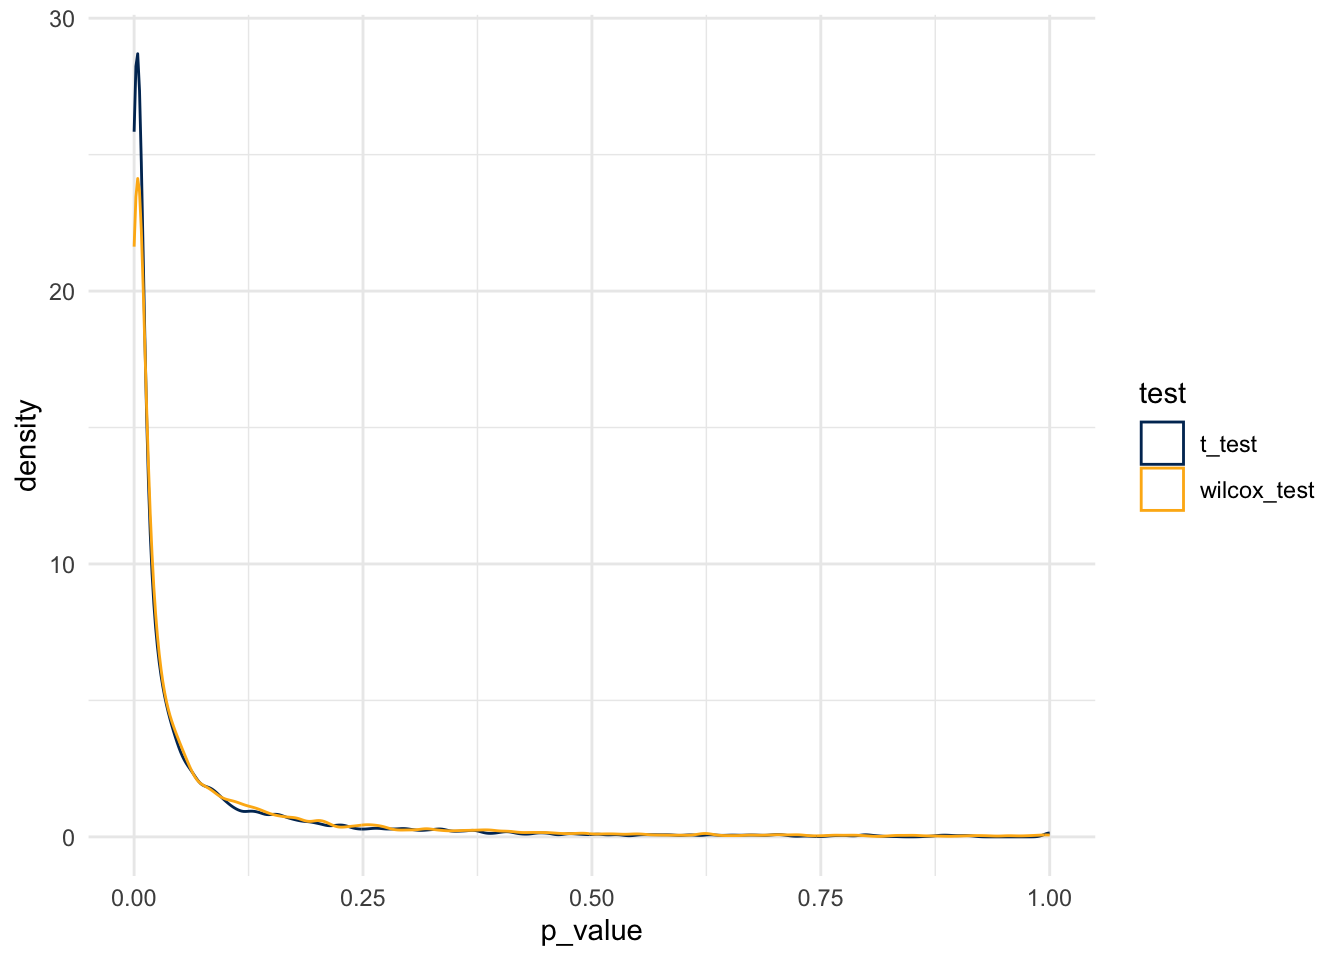
And so, the simulation rejects the null at the following rates:
- For the t-test, at a rate of 0.0650033
- For the Wilcox test, at a rate of 0.0748107
7.11.3 What if a distribution is much more skewed?
Code
skewed_sim <- function(num_sims=1000, num_observations, alpha_1, beta_1, alpha_2, beta_2) {

  t_test_result <- rep(NA, num_sims)
  wilcox_result <- rep(NA, num_sims)

  for(i in 1:num_sims) {
    group_one <- rbeta(n=num_observations, shape1 = alpha_1, shape2 = beta_1)
    group_two <- rbeta(n=num_observations, shape1 = alpha_2, shape2 = beta_2)

    t_test_result[i] <- t.test(group_one, group_two)$p.value
    wilcox_result[i] <- wilcox.test(x=group_one, y=group_two)$p.value
  }

  dt <- data.table(
    p_value = c(t_test_result, wilcox_result),
    test    = rep(c('t_test', 'wilcox_test'), each = num_sims)
  )

  return(dt)
}
7.11.4 False Rejection Rates
Start with a distribution that has parameters alpha=2, beta=7.
Code

Code
same_dist_small_data <- skewed_sim(
  num_observations=10,
  alpha_1=2, beta_1=7,
  alpha_2=2, beta_2=7
  )
same_dist_med_data <- skewed_sim(
  num_observations=50,
  alpha_1=2, beta_1=7,
  alpha_2=2, beta_2=7
  )
same_dist_big_data <- skewed_sim( # haha, "big data"
  num_observations=100,
  alpha_1=2, beta_1=7,
  alpha_2=2, beta_2=7
  )
Code
plot_1 <- same_dist_small_data %>%
  ggplot() +
  geom_density(aes(x=p_value, color = test), bounds=c(0,1)) +
  scale_color_manual(values = c(berkeley_blue, berkeley_gold))
plot_2 <- same_dist_med_data %>%
  ggplot() +
  geom_density(aes(x=p_value, color = test), bounds=c(0,1)) +
  scale_color_manual(values = c(berkeley_blue, berkeley_gold))
plot_3 <- same_dist_big_data %>%
  ggplot() +
  geom_density(aes(x=p_value, color = test), bounds=c(0,1)) +
  scale_color_manual(values = c(berkeley_blue, berkeley_gold))

plot_1 / plot_2 / plot_3
- T-tests
- 0.055
- 0.046
- 0.056
- Wilcox Tests
- 0.046
- 0.048
- 0.061
7.11.5 What about Power to Reject
Code
small_diff_small_data <- skewed_sim(
  num_observations=10,
  alpha_1=2, beta_1=7,
  alpha_2=2, beta_2=5
  )
small_diff_med_data <- skewed_sim(
  num_observations=50,
  alpha_1=2, beta_1=7,
  alpha_2=2, beta_2=5
  )
small_diff_big_data <- skewed_sim( # haha, "big data"
  num_observations=100,
  alpha_1=2, beta_1=7,
  alpha_2=2, beta_2=5
  )
Code
plot_1 <- small_diff_small_data %>%
  ggplot() +
  geom_density(aes(x=p_value, color = test), bounds=c(0,1)) +
  scale_color_manual(values = c(berkeley_blue, berkeley_gold))
plot_2 <- small_diff_med_data %>%
  ggplot() +
  geom_density(aes(x=p_value, color = test), bounds=c(0,1)) +
  scale_color_manual(values = c(berkeley_blue, berkeley_gold))
plot_3 <- small_diff_big_data %>%
  ggplot() +
  geom_density(aes(x=p_value, color = test), bounds=c(0,1)) +
  scale_color_manual(values = c(berkeley_blue, berkeley_gold))

plot_1 / plot_2 / plot_3
7.11.6 Paired compared to unpaired tests
Code
paired_sim <- function(num_sims=10000, num_observations, mean_one, mean_two, paired_diff, sd_one, sd_two) {

  unpaired_test_unpaired_data <- rep(NA, num_sims)
  unpaired_test_paired_data   <- rep(NA, num_sims)
  paired_test_unpaired_data   <- rep(NA, num_sims)
  paired_test_paired_data     <- rep(NA, num_sims)

  for(i in 1:num_sims) {
    observation_a1 <- rnorm(n = num_observations, mean = mean_one, sd = sd_one)
    ## first create unpaired data
    observation_b <- rnorm(n = num_observations, mean = mean_two, sd = sd_two)
    ## then, create paired data
    observation_a2 <- observation_a1 + rnorm(n = num_observations, mean = paired_diff, sd=sd_two)

    ## run tests
    unpaired_test_unpaired_data[i] <- t.test(x=observation_a1, y=observation_b,  paired=FALSE)$p.value
    unpaired_test_paired_data[i]   <- t.test(x=observation_a1, y=observation_a2,  paired=FALSE)$p.value
    paired_test_unpaired_data[i]   <- t.test(x=observation_a1, y=observation_b,  paired=TRUE)$p.value
    paired_test_paired_data[i]     <- t.test(x=observation_a1, y=observation_a2, paired=TRUE)$p.value
  }

  dt <- data.table(
    p_value = c(unpaired_test_unpaired_data, unpaired_test_paired_data,
                paired_test_unpaired_data,   paired_test_paired_data),
    test    = rep(c('unpaired data, unpaired test', 'paired data, unpaired test',
                    'unpaired data, paired test', 'paired data, paired test'), each = num_sims)
  )

  return(dt)
}
Code
Code
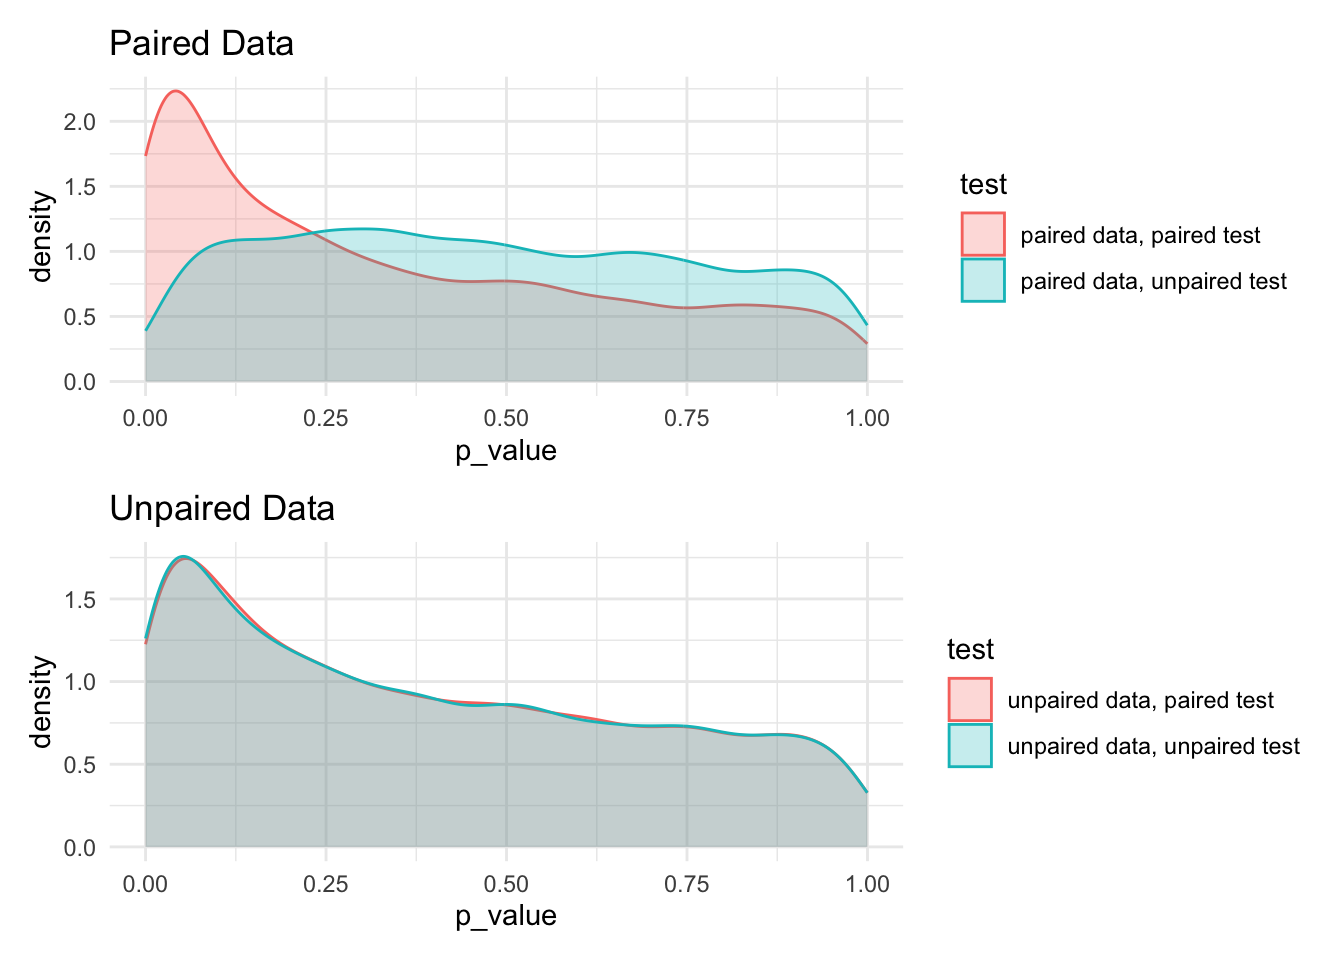
paired_data_plot <- bar[grep('unpaired data', test, invert=TRUE)] %>%
  ggplot() +
    aes(x=p_value, color = test, fill = test) +
    geom_density(alpha=0.25) +
  labs(title = 'Paired Data')
unpaired_data_plot <- bar[grep('unpaired data', test, invert=FALSE)] %>%
  ggplot() +
    aes(x=p_value, color = test, fill = test) +
    geom_density(alpha=0.25) +
  labs(title = 'Unpaired Data')

paired_data_plot / unpaired_data_plot